
Font Size
(100 million yen)
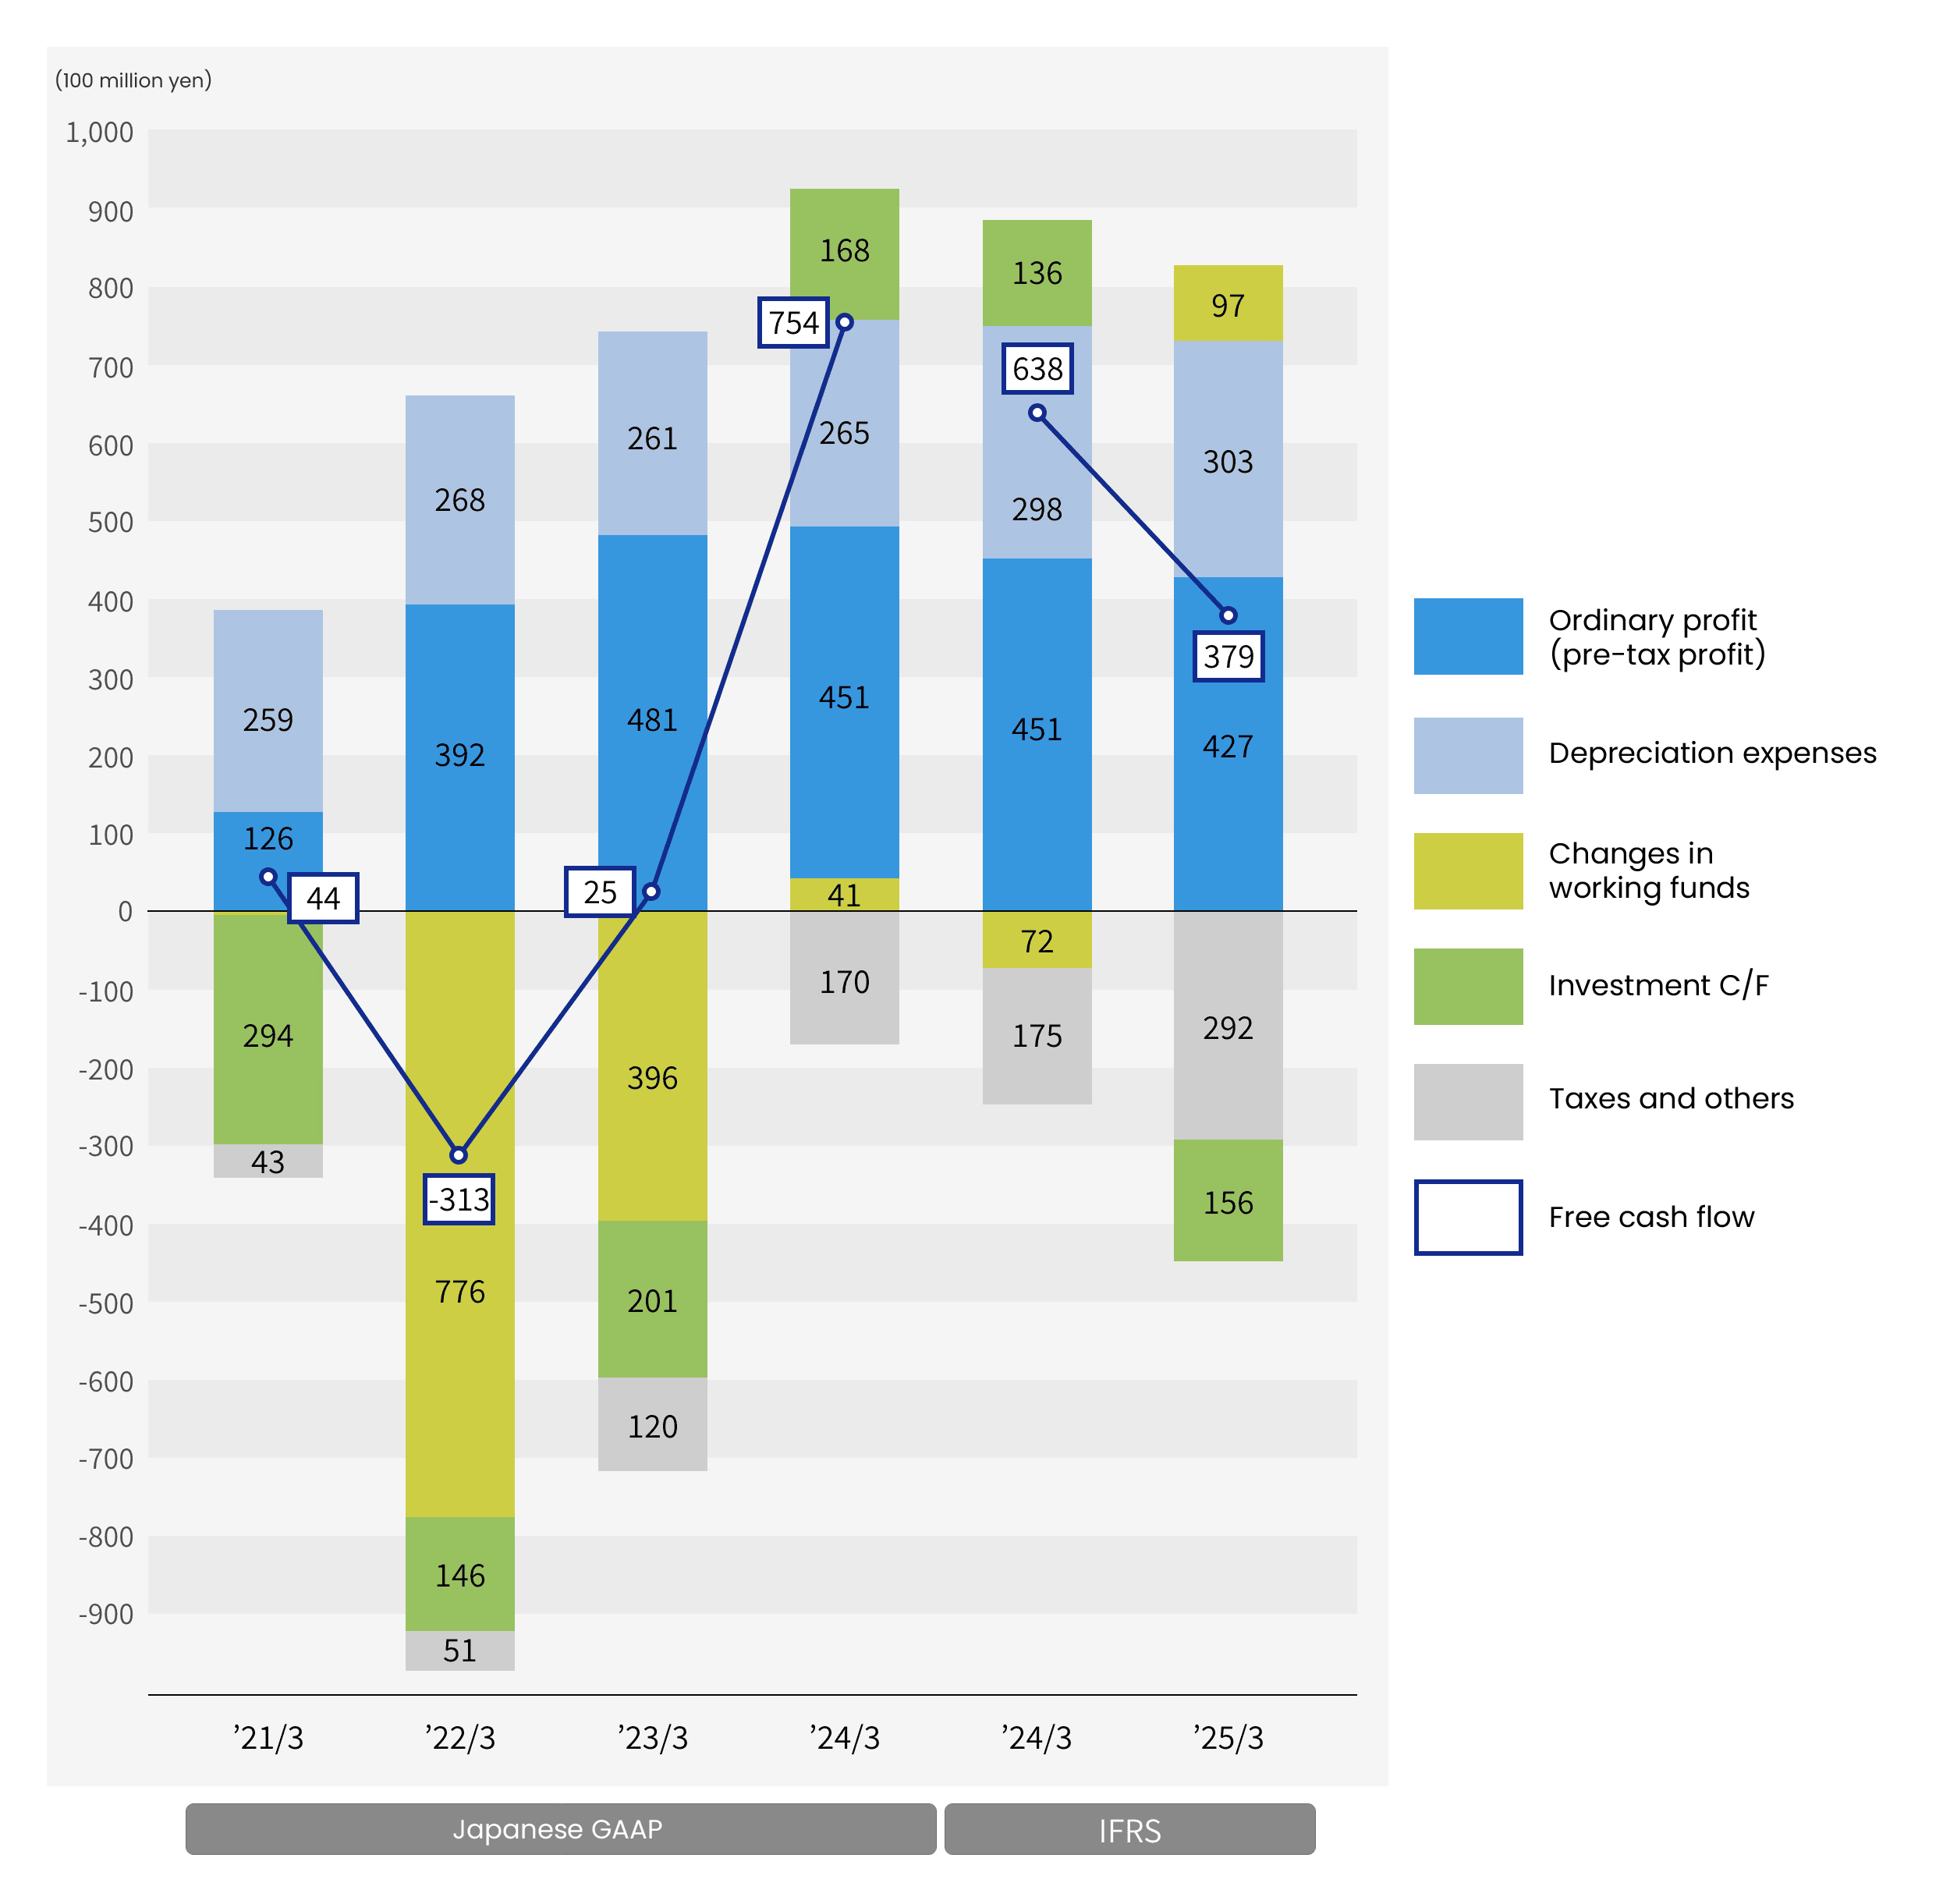
| Fiscal Year Ended March 2022 | Fiscal Year Ended March 2023 | Fiscal Year Ended March 2024 | |||
|---|---|---|---|---|---|
| Operating C/F | Ordinary profit | 392 | 481 | 450 | |
| Depreciation expenses | 268 | 261 | 265 | ||
| Changes in working funds | Accounts receivable | -239 | -80 | 48 | |
| Accounts payable | -28 | -59 | -65 | ||
| Inventory | -509 | -257 | 58 | ||
| -776 | -396 | 41 | |||
| Taxes and others | -51 | -120 | -170 | ||
| -167 | 226 | 586 | |||
| Investment C/F | Capital investments (tangible fixed assets) | -191 | -215 | -272 | |
| Others | 45 | 14 | 440 | ||
| -146 | -201 | 168 | |||
| Free cash flow | -313 | 25 | 754 | ||
IFRS (FY2023 and after)
(100 million yen)
| FY2023 | FY2024 | FY2025 | |||
|---|---|---|---|---|---|
| Operating C/F | Pre-tax profit | 451 | 427 | 448 | |
| Depreciation expenses | 298 | 303 | 311 | ||
| Changes in working funds | Accounts receivable and others | -125 | 236 | 96 | |
| Accounts payable and others | -16 | -55 | -7 | ||
| Inventory | 69 | -84 | 8 | ||
| -72 | 97 | 97 | |||
| Taxes and others | -175 | -292 | -196 | ||
| 502 | 535 | 660 | |||
| Investment C/F | Capital investments (tangible and intangible fixed assets) | -324 | -416 | -526 | |
| Others | 460 | 260 | 44 | ||
| 136 | -156 | -482 | |||
| Free cash flow | 638 | 379 | 178 | ||
(Note)
- We adopted International Financial Reporting Standards (IFRS) starting with the Securities Report for the fiscal year ended in March 2024.